Your customer-facing knowledge base isn’t just a repository of information—it’s a strategic asset that directly impacts customer satisfaction, support efficiency, and your bottom line. Yet many organizations struggle to effectively measure its performance. Instead, they rely on basic pageviews or vague feedback rather than comprehensive metrics that drive continuous improvement.
Without proper measurement, even the most well-designed knowledge base can gradually lose effectiveness, failing to keep pace with evolving customer needs. The key challenge isn’t collecting data—modern platforms generate plenty—but identifying which metrics meaningfully reflect success and drive strategic decisions.
This guide explores the essential metrics that reveal how your knowledge base truly performs, connects these measurements to business outcomes, and provides practical strategies for implementation. Whether you’re launching a new knowledge base or optimizing an existing one, these data-driven approaches will help you transform it from a static repository into a dynamic, high-performing customer success engine.
Core Knowledge Base Metrics Categories
Effective measurement requires examining your knowledge base from multiple perspectives. While individual metrics provide specific insights, the most valuable understanding comes from analyzing patterns across these five core categories:
Usage and Traffic Metrics
Usage metrics establish the foundation of knowledge base analysis by revealing how customers interact with your content at scale.
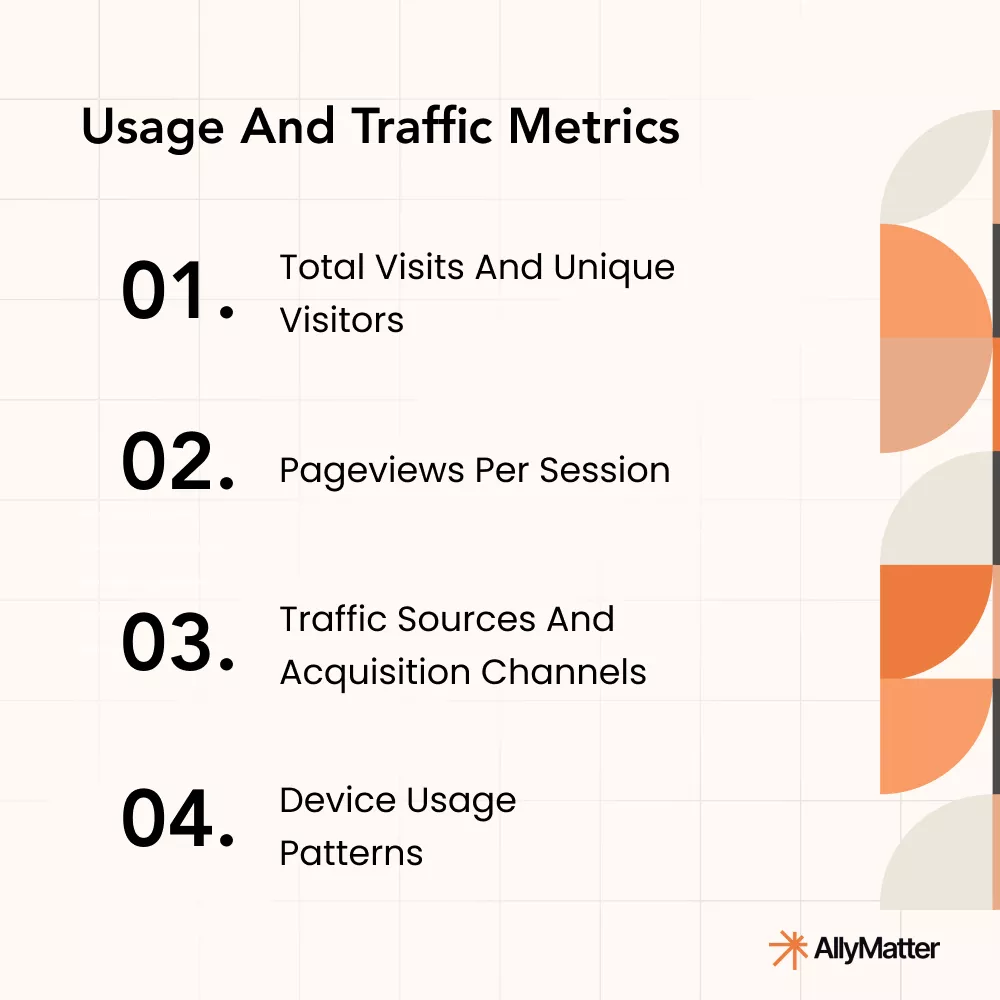
Total visits and unique visitors provide the most fundamental measure of reach. Beyond raw numbers, examine trends over time, particularly in relation to your customer base growth. Is your knowledge base scaling proportionally with your customer growth, or is engagement declining relative to your expanding user base?
Pageviews per session reveal engagement depth. A healthy knowledge base typically shows users viewing 2-4 pages per session—enough to find comprehensive information without excessive searching. Extremely high or low values warrant investigation.
Traffic sources and acquisition channels help you understand how customers discover your knowledge base. Direct traffic often indicates deliberate visits from existing customers, while search engine traffic may reflect new prospects researching your solutions. Internal referrals from your support pages or product interface can indicate successful integration points.
Device usage patterns reveal not just technical needs but user contexts. Mobile usage spikes might indicate customers troubleshooting on-the-go, while desktop dominance could suggest more in-depth research. These patterns should inform your content formatting and design priorities.
Content Performance Metrics
Content metrics help you understand which information resonates with users and where gaps exist.
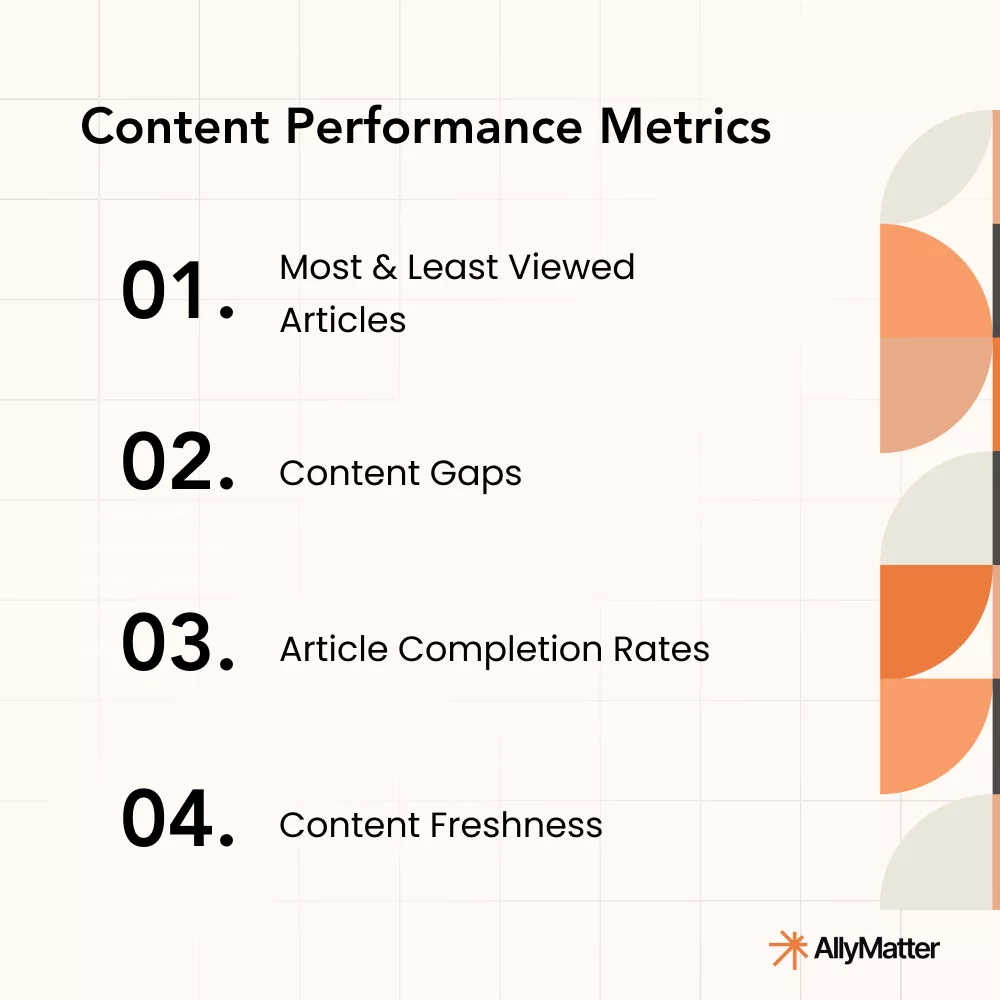
Most and least viewed articles identify your content workhorses and underperformers. High-traffic articles deserve special attention during updates, while consistently low-performing content may require revision, consolidation, or retirement. Look beyond simple popularity to identify unexpected patterns—why might a seemingly niche topic receive substantial traffic?
Content gaps become visible through searches that yield no results or have high bounce rates. These represent unmet information needs and opportunities for content development. Regular analysis of these gaps often reveals emerging issues before they generate support tickets.
Article completion rates measure whether users read entire articles or abandon them. Low completion rates may indicate content that’s too long, poorly structured, or mismatched to user expectations from the title. For critical instructional content, completion rates directly correlate with successful task completion.
Content freshness metrics track when articles were last updated relative to product changes, ensuring accuracy and relevance. Establish standard review cycles based on content criticality, with customer-facing product documentation typically requiring more frequent review than background information.
Search Effectiveness Metrics
These metrics reveal how efficiently users can find what they’re looking for—often the difference between self-service success and abandonment.
Search usage rates indicate whether users rely on search or browse navigation. High search usage (above 60% of sessions) suggests users may be struggling with navigation or have very specific needs. Very low search usage might indicate search functionality isn’t prominent enough or trusted by users.
Zero-result searches directly highlight content gaps or terminology misalignment between how you describe features and how customers think about them. Track these terms and their volume to prioritize content creation.
Search refinement patterns reveal when initial searches fail to deliver helpful results. Multiple searches within a session may indicate confusing terminology, inadequate content, or search algorithm limitations. Analyze common search sequences to identify problematic information pathways.
Top search terms and trends provide insight into current customer priorities and pain points. Sudden spikes in specific search terms often correlate with product issues, market changes, or external events affecting your customers.
Customer Support Impact Metrics
These metrics connect knowledge base performance to support operations, revealing its effectiveness as a support channel.
Ticket deflection rates measure how effectively your knowledge base reduces support tickets. While direct causation is difficult to establish, you can use approaches such as comparing support volume during knowledge base downtime, tracking pre-ticket knowledge base visits, and conducting user surveys about self-service attempts.
Support volume correlation tracks the relationship between knowledge base updates and support ticket categories. Successful article deployments should show measurable reductions in related support inquiries, typically with a 1-2 week lag as customer behavior adjusts.
Pre/post support contact article views reveal whether customers attempted self-service before contacting support. High pre-contact knowledge base usage with subsequent support requests indicates content gaps or clarity issues. Post-contact views may indicate agents sharing specific articles during interactions.
Knowledge base-assisted resolution time measures how knowledge articles impact support efficiency. Compare resolution times for tickets where agents leveraged knowledge articles versus those handled without documentation support. Well-designed articles typically reduce resolution time by 20-40%.
Business Value Metrics
These metrics translate knowledge base performance into financial and business outcomes.
Cost savings from self-service quantifies support costs avoided through knowledge base deflection. Calculate this by multiplying the number of deflected tickets by your average cost per ticket (including agent time, infrastructure, and management costs). Even conservative estimates typically show significant ROI.
Customer retention correlation examines the relationship between knowledge base usage and renewal rates. Customers who actively engage with your knowledge base often show higher retention rates—not necessarily because the knowledge base itself drives retention, but because active engagement with self-service resources indicates product investment.
Revenue impact can be measured through conversion rates for knowledge articles targeted at prospects, upsell content for existing customers, and support-avoided revenue leakage. Premium knowledge bases with gated content can also provide direct revenue streams.
ROI calculation methodology should be established to consistently demonstrate knowledge base value to stakeholders. Factor in development and maintenance costs against support deflection savings, retention improvements, and direct revenue impacts for a comprehensive picture.
Implementation Strategies
Translating these metrics into actionable insights requires systematic implementation.
Setting up Proper Tracking and Analytics
Implement a combination of web analytics (like Google Analytics), dedicated knowledge base analytics within your platform, and integration with support ticket data. Create custom events to track key actions beyond pageviews, such as search refinements, article ratings, and scrolling behavior that indicates content consumption.
Standardize tracking conventions across your knowledge base to ensure consistent measurement, especially for article categories, customer segments, and traffic sources. This consistency enables more sophisticated analysis as your measurement program matures.
Establishing Meaningful Benchmarks
Initial benchmarks should come from historical data if available, industry standards if not, and then evolve based on your specific context. Most knowledge base metrics show substantial improvement potential in the first year of focused measurement—20-30% increases in search success and article usefulness ratings are common with targeted optimization.
Different content types warrant different benchmarks. Procedural how-to content typically shows higher completion rates than conceptual background information, while troubleshooting articles often have higher search relevance requirements.
Creating Metric-Driven Review Cycles
Establish regular review rhythms at different intervals:
Monthly: Review usage trends, search terms, and zero-result searches to identify immediate content gaps and opportunities.
Quarterly: Analyze deeper patterns in support impact, content performance by category, and search effectiveness to guide content strategy adjustments.
Annually: Evaluate business impact metrics, overall health indicators, and technology performance to inform larger investments and strategic shifts.
Cross-Functional Collaboration for Improvement
The most effective knowledge base programs leverage insights from multiple teams:
Support teams can identify common questions not adequately addressed and test article effectiveness during actual customer interactions.
Product teams should synchronize release documentation with knowledge updates, ensuring content reflects current functionality.
Marketing teams can help align knowledge base terminology with customer language and ensure consistent messaging.
Data/analytics teams can assist with setting up proper tracking and developing more sophisticated measurement models.
Common Measurement Challenges and Solutions
Even well-designed measurement programs face several common challenges.
Data Fragmentation Across Platforms
Most organizations find knowledge base data scattered across multiple systems—web analytics, support platforms, customer portals, and internal tools. Create a consolidated dashboard that pulls key metrics from each source, even if manual compilation is initially required. Focus first on the metrics most directly tied to your current strategic priorities rather than attempting to track everything.
Attribution Difficulties
Direct attribution of outcomes (like ticket deflection) to knowledge base usage involves inherent uncertainty. Use multiple attribution methods in parallel: direct tracking where possible, statistical correlation analysis, controlled experiments, and surveying customers about their self-service attempts. The combination provides more reliable insights than any single approach.
Interpreting Qualitative Feedback
Article ratings and feedback provide crucial context but require careful interpretation. Low ratings may not indicate poor content but rather complex issues, emotional customer reactions to the issue itself, or misaligned expectations from search results. Analyze feedback in clusters rather than reacting to individual comments, and look for patterns across rating systems.
Balancing Comprehensiveness With Usability
As measurement sophistication grows, the tendency to track everything can create analysis paralysis. Maintain a tiered approach with 5-7 primary KPIs that align with strategic goals, supported by diagnostic metrics that explain performance drivers. Primary metrics should be widely understood across teams, while specialized metrics can remain within functional areas.
Turning Measurement Into Action
The most sophisticated metrics provide little value without a clear pathway to action. Effective knowledge base optimization follows a consistent cycle:
- Identify performance gaps through metric analysis.
- Hypothesize root causes based on multiple data points.
- Implement targeted improvements.
- Measure results and codify successful approaches.
- Scale proven tactics across the knowledge base.
For example, if search analysis reveals high abandonment for specific terms, examine the content those searches return, test improved articles or redirects, measure the impact on zero-result rates, and then apply the successful approach to other problematic search terms.
The most successful knowledge base programs develop clear playbooks for addressing common metric patterns, enabling consistent improvement even as team members change.
Looking Forward: Evolving Your Measurement Approach
Knowledge base metrics should evolve as your program matures. Initial focus typically begins with basic usage and content metrics, expands to search effectiveness and support impact, and eventually incorporates sophisticated business value metrics.
Advanced programs increasingly leverage AI-driven analytics to identify improvement opportunities automatically, from content gap prediction to personalization effectiveness. While technology can accelerate analysis, the fundamental measurement principles remain consistent—connecting customer needs to appropriate content through efficient pathways.
Ultimately, the most valuable metric is customer success: are your customers able to accomplish their goals through your knowledge base? Every measurement approach should serve this fundamental purpose.
Why AllyMatter
While many knowledge base platforms offer basic analytics, AllyMatter provides integrated measurement specifically designed for growing organizations focused on customer-facing documentation. Our approach addresses the unique challenges these companies face:
Fragmentation solution: AllyMatter connects knowledge base performance with support ticket data, website analytics, and customer journey information—eliminating the data silos that plague most measurement programs. Our unified dashboard gives stakeholders a complete view of knowledge base impact without manual compilation.
Insight automation: Our platform doesn’t just collect metrics. It actively identifies patterns and opportunities, flagging content gaps, outdated articles, and search effectiveness issues before they impact customer experience. This proactive approach ensures continuous improvement without overwhelming your team.
Customer journey integration: Unlike standalone knowledge bases, AllyMatter tracks how documentation fits within the broader customer experience. See how knowledge articles influence onboarding completion, feature adoption, support interactions, and renewal decisions through our connected customer journey analytics.
Impact demonstration: Our ROI calculator automatically quantifies the business impact of your knowledge base. This makes it easy to demonstrate value to stakeholders and secure resources for continued optimization. Track deflected tickets, reduced resolution times, and customer satisfaction improvements in financial terms.
Most importantly, AllyMatter grows with you, starting with essential metrics for newer knowledge bases and expanding to sophisticated analysis as your documentation program matures—all without requiring dedicated analytics expertise.
Building a Measurement-Driven Knowledge Base Culture
The most successful knowledge bases aren’t just well-measured. They’re supported by organizations that embrace documentation as a strategic asset rather than a necessary cost. This culture shift happens when metrics consistently demonstrate knowledge base impact on customer success, support efficiency, and business outcomes.
Start with metrics that matter most to your current priorities, build systematic improvement processes based on those insights, and gradually expand your measurement sophistication. With consistent attention to the right metrics, your knowledge base can evolve from a static repository to a dynamic, responsive system that continuously adapts to customer needs.
The gap between average and exceptional knowledge bases isn’t content volume—it’s the ability to measure, learn, and improve based on real user behavior. By implementing these essential metrics, you’re not just tracking performance; you’re building the foundation for knowledge base excellence.
Join the AllyMatter waitlist today to see how our integrated analytics can transform your customer-facing documentation.